Evolution of E/E Architecture
With the evolution of automated driving, electrification and connected technology, the electronic and electric control (E/E architecture) of automobiles is becoming increasingly complex and sophisticated. The overall E/E architecture is becoming a very large and complex system, with multiple ECUs working together. It is said that each car has more than several dozen microprocessors and more than 50 million lines of software.

The R-Car S4, announced by our company in October 2021, is the core device of E/E architecture that supports high performance and a variety of high-speed networks. R-Car S4 is equipped with several microprocessors such as Arm® Cortex®-A52, Arm® Cortex®-R55 and G4MH/RH850. The software on these microprocessors works together across processors to enable the advanced applications required by the new E/E architecture, such as gateway functions that securely connect the in-vehicle network to the off-vehicle network.
Multi-Core System Debugging
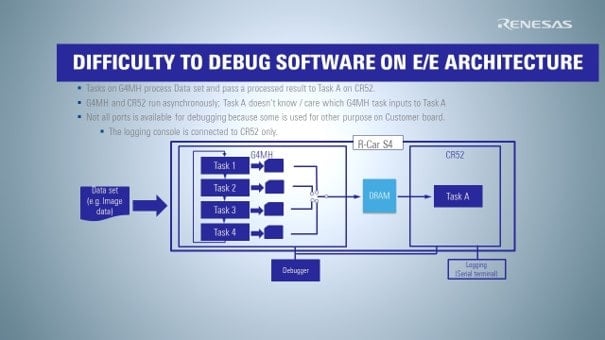
Consider developing software that works together on such multiple microprocessors. For example, suppose that the software on each of the Arm Cortex-A52, Arm Cortex-R55 and G4MH/RH850 microprocessors in R-Car S4 is working together and that some abnormality occurs in the G4MH/RH850 software. (Figure 2)
In conventional debugging methods, the G4MH/RH850 is stopped, and the status of registers, memory and variables are examined using a debugger. However, even if the G4MH/RH850 is stopped, the Arm Cortex-A52 and Arm Cortex-R55 are still running, so when a problem occurs in the G4MH/RH850 software, the Arm Cortex-A52 and Arm Cortex-R55 software cannot be checked. Even if you try to see what was happening, you may not be able to get to the problem because you have moved on without stopping, or because stopping the G4MH/RH850 software has changed the operating state.
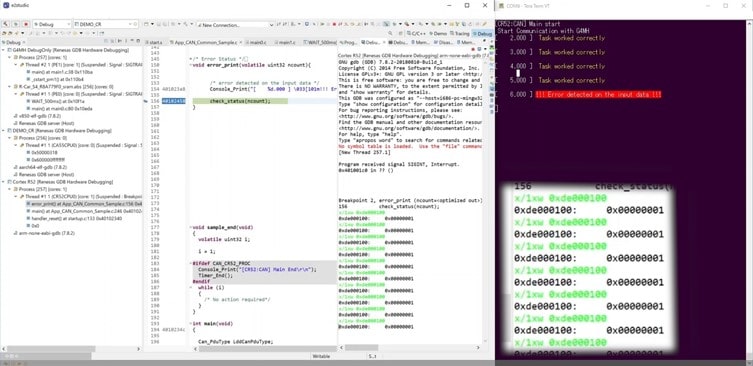
The synchronous debugging function using the multi-core debug and trace tool released this time enables synchronous execution and stop at a certain timing, making it possible to check the status of registers, memory and variables at the timing when the abnormality occurred, as well as the software status. As a result, problems can be analyzed, and causes identified efficiently.

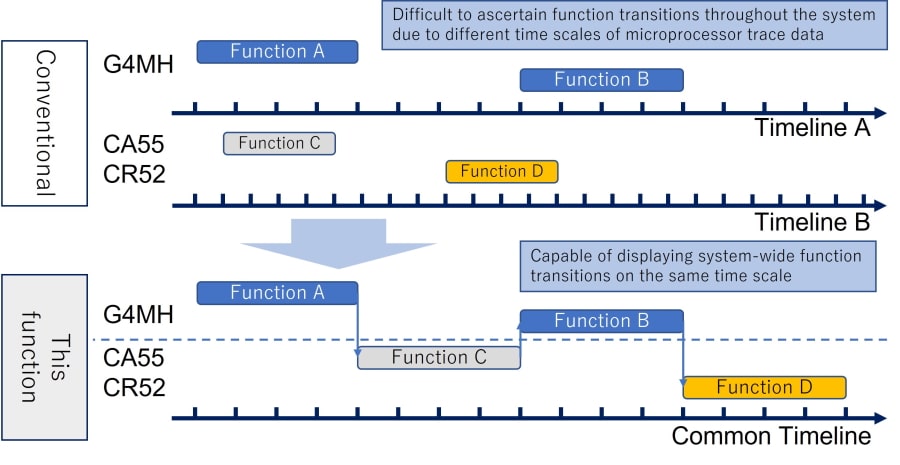
Another function of the multi-core debug and trace tool, synchronous tracing can be used not only for problem analysis, but also for performance improvement by clearly checking execution speed bottlenecks at a glance. For example, as shown in Figure 3, the conventional trace function confirms the flow of software operation by checking the transitions of each microprocessor function. However, since the time scale of each trace is different, it is difficult to grasp the flow of software that is working together. With the synchronous trace function, the timeline of trace results for all microprocessors is the same, and the flow of each software operation can be clearly understood immediately. Problem analysis and performance improvement studies can then be carried out very easily.

Please refer to the video demonstration and explanation of the synchronous debugging function.


Future Developments
Multicore debug and trace tools are a powerful ally for analyzing the behavior of software running in complex intertwined E/E architectures. The released tool targets multiple microprocessors implemented in a single SoC, such as the R-Car S4. In the future, we plan to make this tool even more effective for software development at the ECU (Electronic Control Unit) level by adding support for synchronous debugging and tracing of software that operates in conjunction with multiple devices, as well as support for Virtual Turnkey, which was announced at the same time as this release. We also plan to support Virtual Turnkey, which was announced at the same time.


