Overview
Description
This simulator product makes source level debugging of applications possible in the Renesas integrated development environment, or the High-performance Embedded Workshop, while the target system is not available on hand.
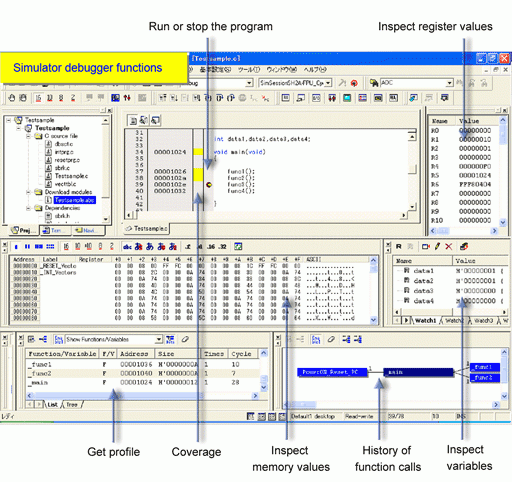
The simulator debugger's exclusive functions (high-function debugging) permits the programs written in C/C++ language or assembly language to be debugged efficiently while the actual MCU is not available on hand.
- High-accuracy simulation (Cycle accurate)
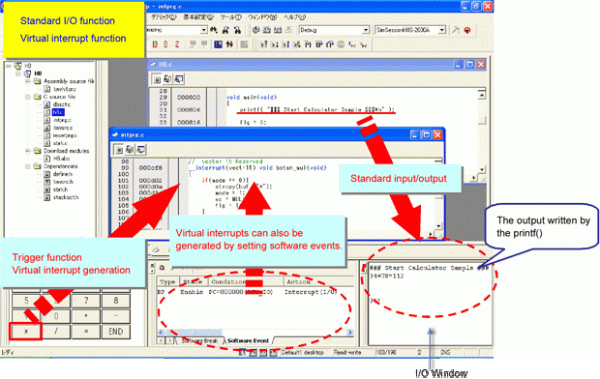
- Simulated I/O function (Standard and file input/output functions usable)
- Virtual interrupt function (Simulation of interrupt operations possible.Virtual interrupts using arbitrary timing and break conditions.Timer module based internal interrupts possible.)
Furthermore, an intuitively understandable easy GUI (graphical user interface) provides a comfortable debug environment.
This product is included in theC/C++ Compiler Package for H8SX, H8S, H8 Family. When the compiler package is installed, the functions of this simulator debugger are added to the High-performance Embedded Workshop environment.
Features
- Since the simulator/debugger runs on the host computer, the user can start debugging the program while the actual MCU is not available on hand. This will result in a reduced development period of the entire system.
- The number of instruction execution cycles is calculated by simulating. This enables performance evaluation even in the absence of the actual MCU.
- The functions outlined below are available, which permit program test and debug to be proceeded efficiently.
- Support each CPU in the H8SX, H8S, and H8 Families.
- If an error occurs while the program under debug is running, the user can choose to continue ignoring the error or stop the program.
- Get profile data and measure performance one function at a time.
- Comprehensive break functions (virtual interrupt operations also possible).
- Set and edit memory map.
- Display a history of function calls.
- Display C/C++ and assembler source level coverages.
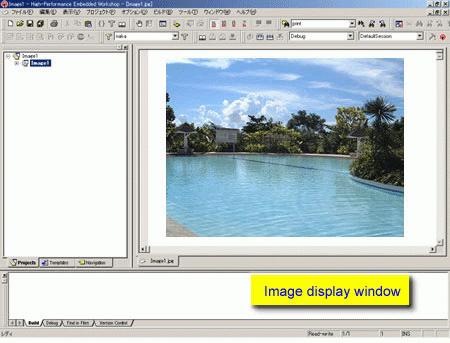
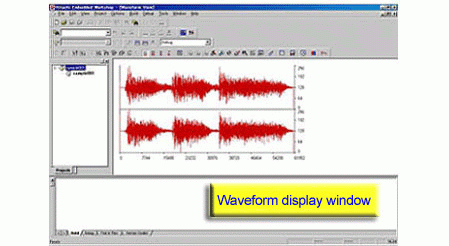
- Visual debug function based on image and waveform display.
- The simulator/debugger runs under Windows, allowing breakpoints, memory map, performance and trace to be set in dialog boxes. The environment setup suitable for the memory map of each MCU in the H8SX, H8S, and H8 Families can also be set in a dialog box.
- Learn More
Release Information
Latest Ver.: V.5.09.00
Released: Jun 7, 2010
Details of upgrade (See Tool News)
Operating Environment
Notes
- If the High-performance Embedded Workshop V.4.07.00 has not already been installed in your PC, the simulator debugger for the H8SX, H8S, and H8 families cannot be updated to V.5.09.00. So be sure to update your High- performance Embedded Workshop to V.4.07.00 at first.
- When you run the compiler on Windows 7, update it and then update your High-performance Embedded Workshop to V.4.08.00. For how to update High-performance Embedded Workshop to V.4.08.00, see "High-performance Embedded Workshop Revised to V.4.08.00 (PDF | English, 日本語)".
Target Devices
Additional Details
Functions
- Work efficiency is increased, thanks to builder and debugger integration. (Note1)
- ELF/DWARF2 object formats are supported.
- Number of execution cycles and the number of calls are graphically displayed one function at a time.
- The stack is traced.
- Object optimization is possible by drawing on the information that is output by the profile function.
- Comprehensive breakpoint functions are supported (virtual interrupt operations also possible). (Note1)
- Assembler source level coverage display. (Note1)
- Visual debug function based on image and waveform display. (Note1)
Note
- This function is supported in the H8SX, H8S and H8 family simulator debuggers 4.0 or later that are supplied with the H8SX, H8S and H8 family compiler packages V5.0.
Simulation Range
[Functions Supported by this Simulator Debugger]
- All executable instructions
- Exception handling
- Registers
- Entire address space
- Peripheral functions listed below in Table 1
| Simulator | Mode | SYSCR registers | Timer |
|---|---|---|---|
| H8/300 Simulator | — | — | |
| H8/300L Simulator | — | — | |
| H8/300HA Simulator | Advanced | — | — |
| H8/300HN Simulator | Normal | — | — |
| H8S/2600A Simulator | Advanced | lens | panorama_fish_eye |
| H8S/2600N Simulator | Normal | lens | panorama_fish_eye |
| H8S/2000A Simulator | Advanced | — | panorama_fish_eye |
| H8S/2000N Simulator | Normal | — | panorama_fish_eye |
| H8SX Normal Simulator | Normal | lens | panorama_fish_eye |
| H8SX Advanced Simulator | Advanced | lens | panorama_fish_eye |
| H8SX Maximum Simulator | Maximum | lens | panorama_fish_eye |
lens Supported | panorama_fish_eye Partly supported | — Unsupported
[Functions Not Supported by this Simulator Debugger]
- Dual-ported RAM
- Pulse width modulator (PWM)
- Serial communication interface (SCI)
- A/D converter
- I/O ports
- Interrupt controller
Note: Use an emulator to debug these functions.
Support
Knowledge Base
- How to set the offset to download an absolute file (*.abs) in High-performance Embedded Workshop when the debugger is connected
... do so, use the following procedure. When you connect the debugger, go to [Download modules] in the workspace window. Right click on Absolute file (*.abs) and select [Properties].Set offset to 0, check [Download debug information only] and execute download.Right click on [Download modules] in the workspace window, and ...
Apr 26, 2017 - How to execute the command code to run a batch file?
... recognized. Change the file path specification method as shown below, according to whether TCL (Tool Command Language) is Enable/Disable. When TCL is disable, and>tcl(ret)>tcl disable>FL "C:¥Program Files¥Renesas¥tutorial.abs" When TCL is enable, and>tcl(ret)>tcl enable>FL ¥"C:¥¥Program Files¥¥Renesas¥¥tutorial.abs¥"
Oct 19, 2009 - How to avoid error message using High-performance Embedded Workshop?
... be referred by watch window. In case variable itself does not exist due to optimization of toolchain.The optimization function of toolchain analyzes program structure and deletes unnecessary (redundant) transaction. The deleted variable is not able to be referred with watch window. If you want to release from to be ...
Nov 30, 2012

Support Communities


