Overview
Description
The simulator debugger for M16C series and R8C family of microcontrollers allows you to run and evaluate your application program without any target hardware by using the Renesas High-performance Embedded Workshop integrated development environment (IDE). It provides a source-level-debugging environment with abundant break features and advanced functions such as coverage measurement and virtual interrupts. In addition, its user friendly and multi-window (overlappable) interface offers stress-free debugging environment.
This product is a component of the C/C++ Compiler Package for M16C Series and R8C Family [M3T-NC30WA]. Installing the compiler package allows debugging using this simulator debugger in a High-performance Embedded Workshop environment (Renesas IDE).
Features
- Possible to evaluate the performance through the cycle accuracy (Cycle counts can be measured in consideration of bus width, instruction queue buffer and wait states.)
- I/O script function (peripheral I/O simulation such as a timer)
- Interrupt simulation function
- Programming a target system using the GUI Input Window and GUI Output Window for simple targetless debugging
- Debugging through the use of the printf() function
- Comfortable debugging environment provided by drag & drop operation
- C/C++ language and assembly language source level debugging and many other basic debug features
- RAM monitoring
- On-line help in HTML
- Learn More
Release Information
Latest Ver.: V.1.06 Release 00
Released: Apr 1, 2011
Details of upgrade (See Tool News)
- Buy the product
- This product is NOT available separately, but only included in the "C/C++ Compiler Package for R8C and M16C Families".
- Get a free upgrade version
- You can download free updates from the Auto Update Utility.
Target Devices
Additional Details
Functions
Basic Functions
| Functions | Description |
|---|---|
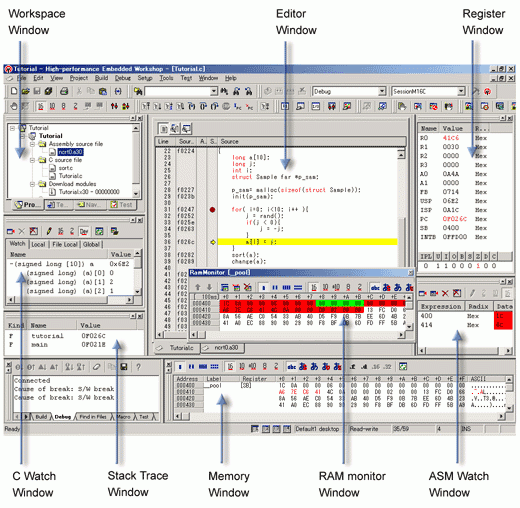
| Register Window | Displays/changes content of flags and registers particular to the MCU. |
| Memory Window | Displays memory content together with the address and label. Display format can be selected from among binary, decimal, hexadecimal, ASCII, SJIS (for Japanese) or JIS (for Japanese) . |
| RAM Monitor Window | Displays memory content changed during target program execution. The area read during program execution is displayed in green, and the area written is displayed in red. (You can set colors of your choice.) |
| ASM Watch Window | Monitors changes in memory content and variable content declared on the assembly language level. Display format can be selected from among binary, decimal, and hexadecimal. If the specified address is within the real-time RAM area, the area read is displayed in green, and the area written is displayed in red. (You can set colors of your choice.) |
| C Watch Window | Displays C/C++ variable contents. In addition to a window that displays variable formula of your choice, there are windows that display external variables, local variables within a file, and local variables within a function. |
| Stack Trace Window | Displays function call information of C/C++ language. |
| Script Window | Window for executing commands from the keyboard or script files. An area is provided for displaying command execution results and command history. Execution results can be output to a file. |
| S/W Break Point Setting Window | Enables set / cancel the software break points. You can set up to 64 break points (OR condition). |
| H/W Break Point Setting Dialog | Enables set / cancel the hardware break points. You can set up to 64 break points (OR condition). |
Advanced Functions
| Functions | Description |
|---|---|
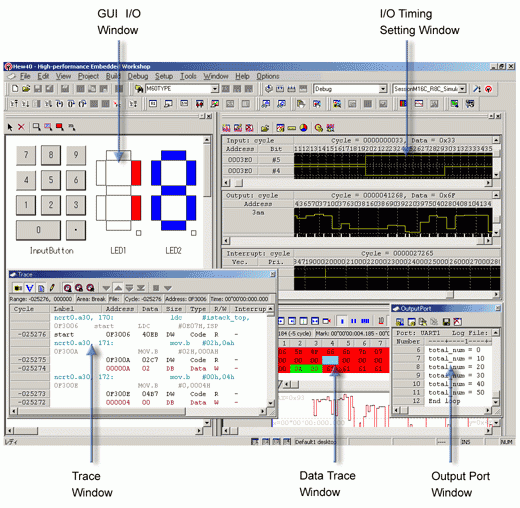
| I/O Timing Setting Window | Inputs/outputs to a port, and sets/displays interrupts. It is also possible to check cycle-by-cycle data input, definition of interrupt, and change of output data. And, a timer interrupt occurrence at time intervals in units of msec/µsec is enabled. (Note that the CPU operating frequency need to be specified.) Besides, there is the I/O script function that can simulate peripheral I/O (timer, analog to digital converter, etc.) operation. By registering I/O script of peripheral I/O (written in script format in a file) in the I/O window, you can simulate operation of that device. For example, to simulate timer operation, register the following script with "while" and "if": [I/O script defining example of timer operation]
 {
  while(1){
    if( ([0x380].b & 0x01) == 0x01){
      ; Down count of Counter
        waitc [0x386].W + 1

      ; Timer interrupt occurs
        int 21,[0x55].b & 0x7
    }else{
        waiti 100
    }
  }
 }
|
| GUI I/O Window | Window for creating key input panels or output panels for the user target system by simple mouse operation. [Input panel]: You can define operation of data input or interrupt for the created keys. Pressing the key while the program is running generates data input or interrupt. [Output panel]: You can display by LED or label according to the value of the output data. |
| Output Port Window | Prints a result of output using the printf() function to the window or a file. |
| Trace Point Setting Window | Sets/cancels trace points. Can set 6 trace points maximum and specifies the combination condition of trace events. For starting and stopping events for tracing, either memory access (read/write) or instruction execution is specifiable. As a combination condition, there are AND and OR. |
| Trace Window | Displays the results of tracing. The following three display modes are supported: Bus mode, Disassemble mode and Source mode. |
| Data Trace Window | Graphically shows the data access information on the results of tracing. |
| Coverage Window | Shows coverage measurement results of C/C++ language functions. Start/end addresses and coverage can be checked. Double-clicking the line to be checked opens a coverage source window to show executed/unexecuted in a line of source. |
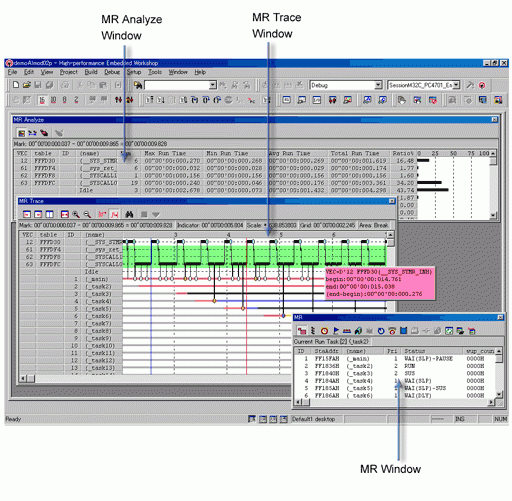
| MR Window | Shows the state of the real-time OS M3T-MR30. |
| MR Trace Window | Graphically shows task execution histories of programs using the real-time OS M3T-MR30. Also, each history of interrupt handling and system call issuing is shown together. |
| MR Analyze Window | Shows the results of statistical processing of measured data in the range specified with the MR trace window. And shows the list of the following records : the occupation status per interrupt handler or task, history of system call issuing. |
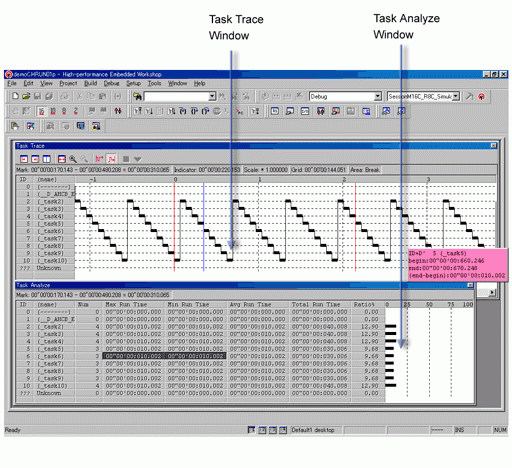
| Task Trace Window | Graphically shows task execution histories of programs using real-time OS. |
| Task Analyze Window | Shows the results of statistical processing of measured data within the range specified with the Task Trace Window. This window shows the occupancies of tasks in a CPU. |
Specifications
| Functions | Description |
|---|---|
| I/O simulation | Data can be input/output cycle-by-cycle. |
| Interrupt simulation | Interrupt occurrence in units of cycles or time (msec/µsec) is enabled. |
| Execution time measurement | Execution time is worked out by the CPU operating frequency and the number of CPU execution cycles. (Note1) |
| Tracing feature | Trace logging up to 256K cycles is possible. |
| RAM monitor display | Any 1K byte of memory is displayable. |
| Coverage measurement | Coverage of all memory area can be measured. |
Note
- It's possible to select the cycle accuracy mode which measures the cycle counts extremely precisely.
Support
Support Communities
- About the program upload in R5F2127 6NFP J3A5 Microcontroller
Hello sir, Please help me to upload the program in R5F2127 6NFP J3A5 microcontroller. please explain step by step process
Feb 6, 2024 - Disassembly program opens when i click GO in Debug mode?
... the emulator settings according to the 38D5 group.Thanks in advance.E8a Emulator Software V.1.01 Release 00 (6-29-2012 17:38:40)M16C R8C Simulator Debugger V.1.06 Release 00 (7-2-2012 12:28:16)M16C Series, R8C Family C Compiler V.5.45 Release ...
Jul 12, 2012
Knowledge Base
- How to execute the command code to run a batch file?
... recognized. Change the file path specification method as shown below, according to whether TCL (Tool Command Language) is Enable/Disable. When TCL is disable, and>tcl(ret)>tcl disable>FL "C:¥Program Files¥Renesas¥tutorial.abs" When TCL is enable, and>tcl(ret)>tcl enable>FL ¥"C:¥¥Program Files¥¥Renesas¥¥tutorial.abs¥"
Oct 19, 2009

Support Communities


