Overview
Description
This simulator product makes source level debugging of applications possible in the Renesas integrated development environment, or the High-performance Embedded Workshop, while the target system is not available on hand.
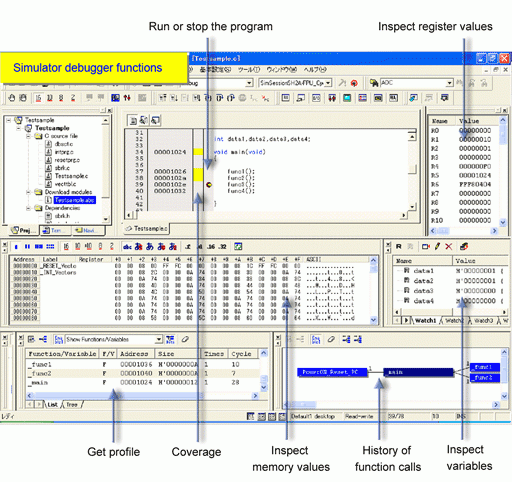
The simulator debugger's exclusive functions (high-function debugging) permits the programs written in C/C++ language or assembly language to be debugged efficiently while the actual MCU is not available on hand.
- High-accuracy simulation[Cycle accurate]
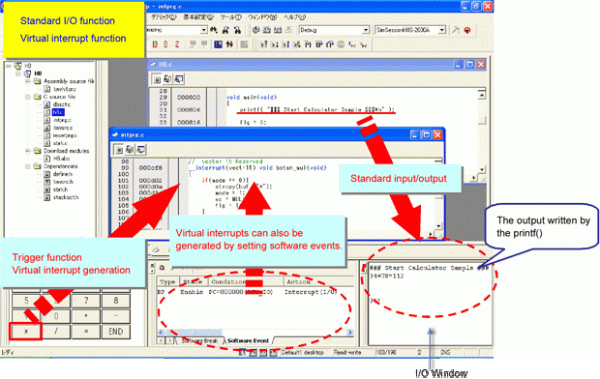
- Simulated I/O function[Standard and file input/output functions usable]
- Virtual interrupt function[Simulation of interrupt operations possible.Virtual interrupts using arbitrary timing and break conditions.Timer module based internal interrupts possible]
Furthermore, an intuitively understandable easy GUI (graphical user interface) provides a comfortable debug environment.
This product is included in the C/C++ Compiler Package for RX Family (for High-performance Embedded Workshop environment). When the compiler package is installed, the functions of this simulator debugger are added to the High-performance Embedded Workshop environment.
Features
- Since the simulator/debugger runs on the host computer, the user can start debugging the program while the actual MCU is not available on hand. This will result in a reduced development period of the entire system.
- The number of instruction execution cycles is calculated by simulating. This enables performance evaluation even in the absence of the actual MCU.
- The functions outlined below are available, which permit program test and debug to be proceeded efficiently.
- If an error occurs while the program under debug is running, the user can choose to continue ignoring the error or stop the program.
- Get profile data and measure performance one function at a time.
- Comprehensive break functions (virtual interrupt operations also possible).
- Set and edit memory map.
- Display a history of function calls.
- Display C/C++ and assembler source level coverages.
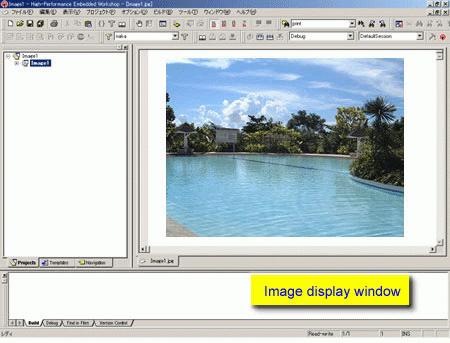
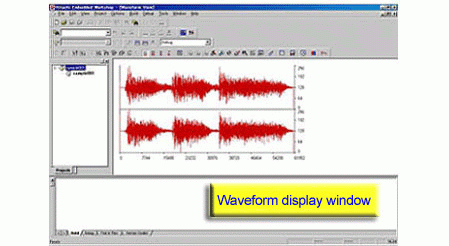
- Visual debug function based on image and waveform display.
- The simulator/debugger runs under Windows, allowing breakpoints, memory map, performance and trace to be set in dialog boxes. The environment setup suitable for the memory map of MCU in the RX Family can also be set in a dialog box.
- Learn More
Release Information
Target Devices
Additional Details
Functions
- Work efficiency is increased, thanks to builder and debugger integration.
- ELF/DWARF2 object formats are supported.
- Number of execution cycles and the number of calls are graphically displayed one function at a time.
- The stack is traced.
- Object optimization is possible by drawing on the information that is output by the profile function.
- Comprehensive breakpoint functions are supported (virtual interrupt operations also possible).
- Assembler source level coverage display.
- Visual debug function based on image and waveform display.
Simulation range
[Functions Supported by This Simulator Debugger]
- All executable instructions
- Exception processing
- Registers
- Entire address space
- Peripheral function(Timer) (Note1)
Note
- Support for the CMT-related features in the interrupt controller (ICU) and a total of four compare match timer (CMT) channels, i.e. two CMT units (unit 0 and unit 1), each with two 16-bit timers.
[Functions Not Supported by This Simulator Debugger]
- Low power state (Note1)
- Non-maskable interrupt (NMI)
- Reception of an interrupt during execution of any of the following instructions (Note2): RMPA, SCMPU, SMOVF, SMOVB, SMOVU, SSTR, SUNTIL, SWHILE
- Values in memory and registers that become undefined after the execution of instructions
- Lower-order 16 bits of the accumulator (ACC)
Notes
- Simulation is stopped on the execution of a WAIT instruction.
- The interrupt is accepted when execution of the instruction is completed.
Note: Use an emulator to debug these functions.
Support
Support Communities
- simulation won't step into main.
I am new to Renesas, HEW and the RX MCU. I am using HEW 4.09.01 with C/C++ compiler for RX family V 1.02 and RX family Simulator Debugger V 1.02.01. I have written a library, and imported it into an application. Because of ...
Oct 19, 2017 - S7G2 SK: Porting to ThreadX
We are planning to port our c/c++ library to ThreadX. As a first step, we are getting familiarized with e2 studio. In this regard, we have the following queries. 1. How to install a S7G2 SK simulator/emulator for debugging?
Oct 24, 2023 - Program in C Language without RPDL ?
Hy, I would like to know if it possible to make a program, using C Language, without using the Renesas Peripheral Driver Library ? I tried to use the CMT with declaration like : #pragma ADDRESS CMSTR0_ADDR 0x88000 // Compare Match Timer Start Register 0 struct bit2_def { char ...
Feb 19, 2014
Knowledge Base
- How to set the offset to download an absolute file (*.abs) in High-performance Embedded Workshop when the debugger is connected
Setting the offset to an absolute file and downloading it when the debugger is connected is not guaranteed in the High-performance Embedded Workshop. The absolute file debug information is an absolute address, and it is assumed it will not be set as an offset. If it is only a ...
Apr 26, 2017 - How to avoid error message using High-performance Embedded Workshop?
... correctly in watch window.Select [build] → [XXXX-Standard Toolchain] from High-performance Embedded Workshop menu. Select the file which the function is defined from the list where is left side of dialog when setting option with invoked dialog, and specify -optimize=0. (-optimize= debug only in case of SH family)
Nov 30, 2012 - How will I know the number of cycle of code execution has been generated?
The execution cycle count can be measured in the simulator environment. If you are using the High-performance Embedded Workshop:Select [View -> CPU -> Status] from the menu of the HEW, click on the [Platform] tabbed page of the [Status] window, and check the number of cycles for execution shown in ...
Oct 29, 2014

Support Communities


