Software development for embedded systems is increasingly complex, especially with the advent of internet connectivity features, which come with their own set of technical challenges. To navigate this complexity, effective tools are essential. In this article, we will explore the capabilities of "Tracealyzer," a tool provided by Percepio, a partner of Renesas.
We will delve into how Tracealyzer can be effectively used to identify and resolve common development challenges and bottlenecks, with practical examples. This tool can be a valuable resource for maximizing its potential, and even those who are not technicians can gain a deeper understanding of its significance in technical discussions.
Internet Connectivity Challenges
Internet connectivity has become a standard feature in modern embedded systems. However, implementing protocol stacks like TCP/IP, MQTT for cloud service connections, or TLS necessitates consideration of a real-time OS. These technical details might seem complex, but the barrier is lowering with the advent of platforms like AWS' FreeRTOS or Microsoft's Azure RTOS.
The Importance of Tuning Products
Maximizing a product's performance requires thorough monitoring and adjustment of its internal workings. This could mean changing settings for faster communication, optimizing memory usage, or adjusting interrupt priorities to improve system responsiveness. This kind of "tuning" is a vital process to enhance the value of a product.
The Power of Tracealyzer
Tracealyzer, provided by Renesas's partner Percepio, is a powerful tool that assists the tuning. It allows real-time monitoring of internal operations, like CPU usage, memory usage, and interrupt occurrences. For example, Tracealyzer can visualize the dynamic allocation of memory (heap memory) used by FreeRTOS when connecting to AWS, allowing for optimization, and freeing up more memory for applications by revising FreeRTOS settings. This tool also makes the CPU usage, previously measured by outputting signals from the microcontroller's general-purpose port and measuring them with an oscilloscope, can now be measured solely using Tracealyzer.
Demonstration of Actual Operation
In the video below, featuring the RX72N Envision Kit, we demonstrate how Tracealyzer can be used for monitoring. This video gives a clear picture of how the tool works, its effectiveness, and its impact on products.
Tracealyzer's Features
As shown in the video, Tracealyzer comes equipped with various monitoring windows. It provides instant insights into critical data like CPU task statuses, CPU load, and memory usage, crucial for development and tuning. These features enable developers to efficiently pinpoint issues and adjust for optimal product performance.
Practical Application Examples
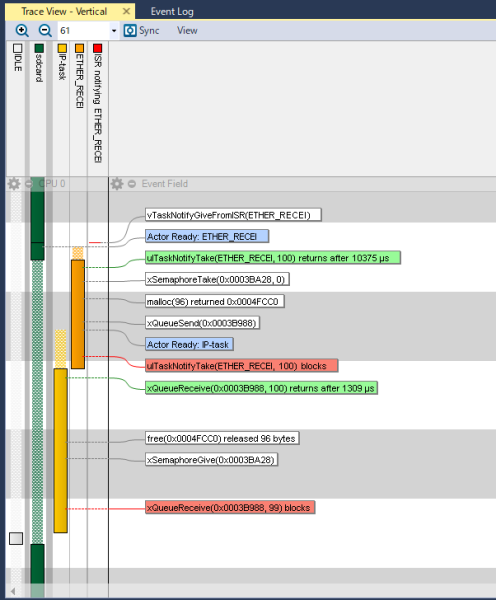
Consider the operation of the RX72N Envision Kit, which performs multiple tasks simultaneously, such as reading data from an SD card, firmware updates, and communication with AWS. Using Tracealyzer, the internal state of these tasks, their priorities, and interrupt operations can be closely monitored. In the diagram, time is shown on the vertical axis flowing downward and tasks are shown on the horizontal axis. Text bubbles represent OS system calls for each task. The diagram illustrates how the SD card control task (sdcard) is interrupted by the Ethernet reception interrupt (ISR notifying ETHER_RECEI), followed by priority execution of the reception process by the IP task (IP-task). Understanding these internal operations during interrupts and "tuning" them can enhance product performance and value.
Conclusion and Future Outlook
Embedded system development is constantly evolving, increasing in complexity. In such a situation, the use of effective tools is essential to maximize product performance and quality. Tracealyzer is expected to provide significant value to many developers and product planners.
Reference Links
For those who want to try Tracealyzer, the RX72N Envision Kit is recommended. The operation confirmation method is posted below.
How to use Tracealyzer · renesas/rx72n-envision-kit Wiki · GitHub
For those who want to try it on boards other than the RX72N Envision Kit, the following application note explaining how to embed monitor software for Tracealyzer into the microcontroller will be helpful.
Tracealyzer® for FreeRTOS Debugging Rev1.01 (PDF | English, 日本語)
Additionally, we introduce a video that explains this application note's content.
How to Debug FreeRTOS Using Tracealyzer® for RX
This application note and video feature the CK-RX65N, which can be used for communication experiments with cloud services like AWS or Azure through Ethernet or cellular connections.

