Overview
Description
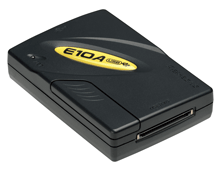
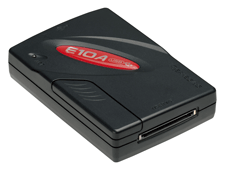
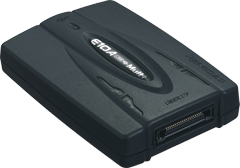
The E10A-USB emulator is an on-chip debugging emulator which supports the development for systems using microcomputers of the SuperH RISC engine family, the H8SX family, and the H8S family. As the main body of the E10A-USB emulator is connected to the user system via the dedicated debug interface (H-UDI and AUD), you can debug in such a form close to the completed product.
Features
- Breakpoints
- Hardware Breakpoints, dependent on device specification
- 255 software breakpoints
- User break
- Trace functions
- 4 branch trace messages stored on device H-UDI capable devices
- Real time branch trace with AUD capable devices -HS0005KCU02H only
- RAM monitor
- The contents of a memory can be referenced and changed during program execution in real-time with AUD capable devices.
- Full source level debug
- Support for Renesas , IAR and GNU compilers
- Host requirement
- PentiumR3 600MHz or greater
- RAM 128MB or greater
- Available hard-disk 50MB or greater
- USB rev 1.1 port
- User I/F
- 14-way connector (Type: 2514-6002: [3M Co., Ltd.])
- 36-way connector (Type: DX10M-36S: [Hirose Electric Co., Ltd.])
- Learn More
Release Information
Target Devices
Downloads
|
|
|
|
|---|---|---|
| Type | Title | Date |
| Upgrade - IDE | ZIP 14.57 MB 日本語 | |
| Upgrade - IDE | ZIP 66.81 MB 日本語 | |
| Upgrade - IDE | ZIP 2.38 MB 日本語 | |
3 items
|
||
Design & Development
Additional Details
Lineup
See the product pages for the details of each model below.
| Item | Description | ||
|---|---|---|---|
| Products | HS0005KCU01H for the H-UDI interface Note1 Image

|
HS0005KCU02H for the AUD trace function Note2 Image

|
HS0005KCU14H for the Multi-core MCUs of SuperH RISC engine Family Image

|
| MCUs |
|
・Multi-core MCUs of SuperH RISC engine Family | |
Notes
- The H-UDI (User Debugging Interface) is an interface compatible with the Joint Test Action Group (JTAG) specifications.
- The AUD (Advanced User Debugger) trace is the large-capacity trace function that is enabled when the AUD pins are connected to the emulator. When an event that starts trace acquisition occurs, the trace information is output in realtime from the AUD pins. For more details, refer to On-chip Debuggers Performance Property (PDF | English, 日本語).