Overview
Description
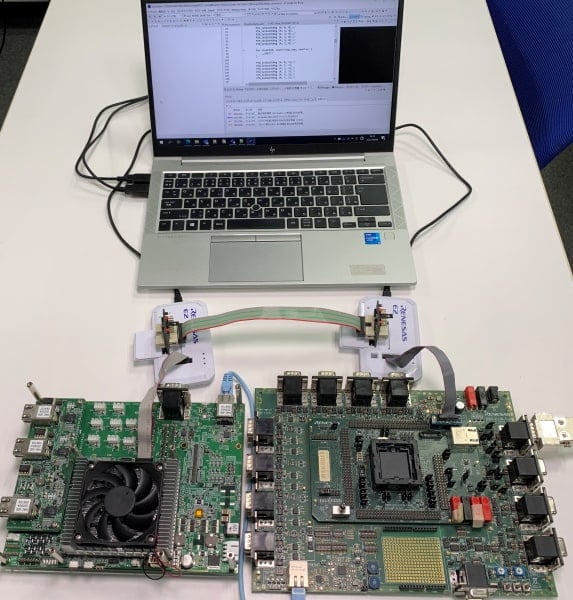
We are pleased to introduce new multi-device synchronous debugging support in the e2 studio integrated development environment. With the evolution of the E/E architecture, there are more and more cases where multiple SoC and MCU devices are mounted in a single ECU and the software on these devices needs to cooperate with each other. Previously, the operation of each device was checked one by one when checking the operation of such software, which made it difficult to debug more and more use cases where the devices share resources and cooperate with each other. For example, it takes a great deal of effort to analyze and determine which device and software is responsible for the problem when a software failure occurs. In response, Renesas has developed "Debug and Trace Tools for Multi-Devices," tools that facilitate analysis and identification of the causes of problems that occur in these systems.
Target Devices
Design & Development
Videos & Training
This video explains how to use multi-device synchronous debugging with e² studio.
An introductory video on multi-device synchronous debugging is also available. Please check it out:
News & Blog Posts
Blog Post Jan 31, 2023 |
Blog Post Oct 21, 2022 |
News Sep 27, 2022 |
Debugging issues when developing systems which use multiple devices
Recent in-vehicle ECU systems are increasingly comprised of multiple in-vehicle SoC and MCU devices and shared resources such as memory and networks needed to operate them in coordination. Developing software for an in-vehicle ECU consisting of multiple devices like this presents different challenges than developing software for a conventional ECU with only a single SoC or MCU.
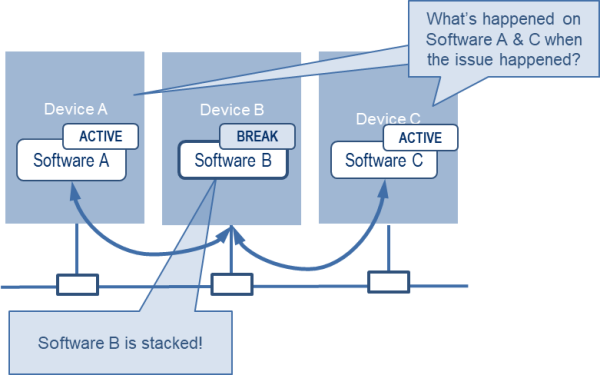
For example, consider an ECU with three devices, Device A, Device B, and Device C. The three devices are connected by a bus or interface such as PCIe or a high-speed serial bus, and the software on each device must work in conjunction with the others.
In this ECU, when something abnormal occurs in Software B running on Device B and you want to debug it, you would normally stop the operation of Device B and check the registers, memory and the status of variables using a debugger. However, even if the operation of Device B is stopped, the other devices will continue to operate as is. When you have a problem with Software B, you want to find out what is happening with Software A or Software C. In this case, you cannot see the status of Software A or Software C because they are still running. Software B, on the other hand, is stopped at this point. Therefore, Software A/B/C will no longer cooperate with each other, making it difficult to identify the problem.
Features
- Expected effects with a use case
- By debugging multiple devices simultaneously, you can check the software operation of the entire system in which each of the devices cooperates, while sharing resources such as memory and the network, identify the cause and analyze the problem in a short time.

Main Functions
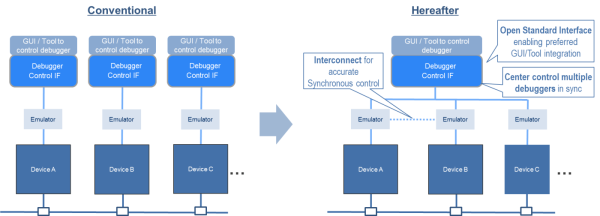
- Complete system debugging in a single IDE
- Multiple devices can be debugged simultaneously in the e2 studio integrated development environment.
- Synchronous execution / synchronous break
- By executing and breaking multiple devices simultaneously with a single action, the behavior of the entire system and its state at the break can be debugged, making it easier to identify unexpected behaviors and bugs.
- Synchronous tracing (scheduled to be supported by the end of 2022)
- The flow of the software operation as a system can be checked collectively by synchronizing the trace data from each device, making it easier to understand what the entire system is doing when a problem occurs.
Support

Support Communities


