"No, no! The adventures first. Explanations take such a dreadful time!"
– Lewis Carroll, "Alice in Wonderland"
Explanations for model behavior are starting to get attention in the AI community. Beginning with government and regulatory bodies, now venture capital is starting to find the topic interesting.
It's easy to understand why. As AI and machine learning models become more widely deployed and more widely depended on, it's natural to ask "how did this happen?" when looking at results. Evidence that algorithms in widely used products exhibit clear social bias has only increased demands to be able to understand how a model reached its predictions.
In our world, that understanding is mission-critical. Reality AI makes machine learning software used by engineers to build products with sensors, who deploy models that run locally, in real-time, in firmware, as part of a product. Our stuff runs in car components, home appliances, and industrial machinery – sometimes in safety-critical applications.
When Explanation is Essential
Since "Explainable AI" is absolutely essential for our customers we've focused on "inherent explainability" — keeping the fundamental functioning of each model conceptually accessible to the design engineer from the first steps of model construction.
How do we do that? We start with the explanation. That is, we construct models from the ground up using feature sets that are grounded in signal processing mathematics, so that everything the model does can ultimately be traced back to statistics and computations based on time and frequency domains. Our inputs are usually sensors with high sample rates (vibration, sound, accelerometers, current and voltage, RF, pressure, that sort of thing), so these kinds of features make a great deal of sense. And it allows us to bring everything back to terms that an engineer understands — even in a machine learning process that is completely data-driven.
Start with the Explanation
For engineering applications, three challenges make Explainable AI absolutely essential:
- Engineers never deploy what they don't understand. Before products get rolled out in the automotive industry, for example, there are extensive technical reviews and lots of testing. Nobody wants to be the engineer at the front of the room shrugging their shoulders and saying "I dunno. Beats me."
- Locally, in firmware, at the Edge. Our customers are typically deploying TinyML models that need to run in highly constrained environments (low cost microcontrollers), often with limited bandwidth available for connections (for example, on a car component), and doing it in real-time. In these environments, there isn't a lot of local storage for historical data, and there isn't always a ready means to stream it to the cloud for analysis later. So models – fully integrated with other hardware and software aspects of the product – must be completely tested prior to deployment as there may not be much opportunity to figure out what went wrong later.
- There's physics down there somewhere. Most engineering applications using sensors are ultimately about physics, and it's very difficult to trust models that have no discernable relation to that underlying physical truth.
A Simple Example
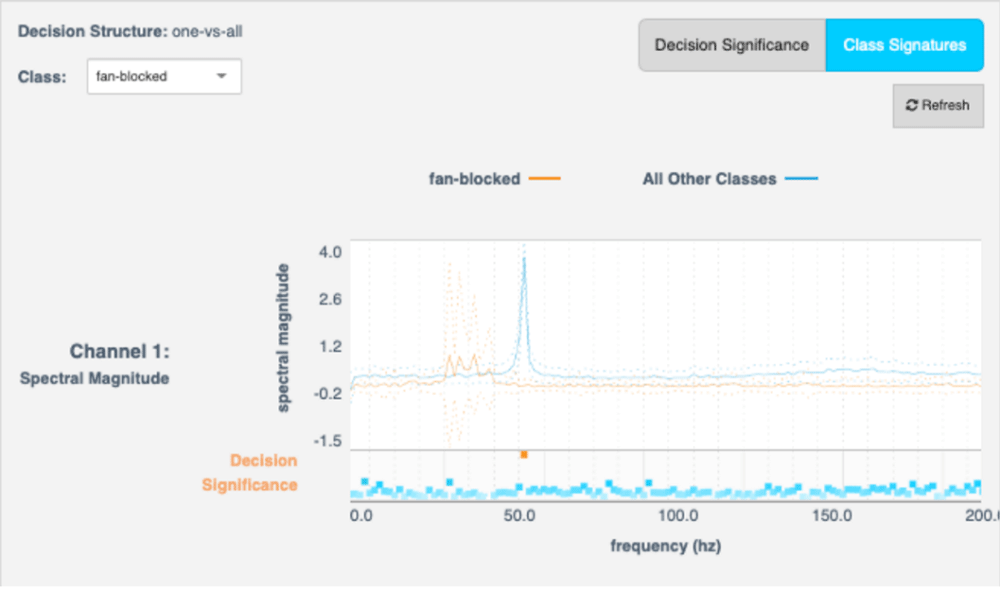
Take for example this "Explainable AI" visualization for a model built in Reality AI Tools® for detecting when the input to a fan is blocked. Reality AI automatically generated this model in a data-driven way by exploring a set of training data, identifying and optimizing features, then creating and tuning a machine learning model based on these features — 100% algorithmically, without input from the user beyond some basic information about the problem and a set of labeled training data.
In this example, we are detecting whether the input to a fan is blocked using 3-axis vibration data from an accelerometer sampled at around 400Hz. "Blocked" is actually one of five different classes detected in this multi-class classifier.
The visualization has two sections, which together illustrate the "class signature" in a way that an engineer can immediately understand. The feature space selected by the Reality AI algorithm in this case is "spectral magnitude," basically the real part of a Fourier transform computed using an FFT. The horizontal axis is frequency and the vertical axis on the top graph is the magnitude. The vertical axis on the bottom graph is "decision significance", a measure of how important that particular location in the feature space is to the distinction between the "Blocked" class and all the others.

What this graph clearly shows is that under other circumstances there is a resonance peak at around 55Hz, but that peak disappears when the fan is blocked. There is information contained in other parts of the spectrum here, but this frequency peak really stands out. This is a clear, easy to understand explanation for any engineer.
A More Complex Example
But our "fan blocked" demo is a very simple signature – one that is so simple we may not have needed machine learning to discover it. What about when the signature is more complex?
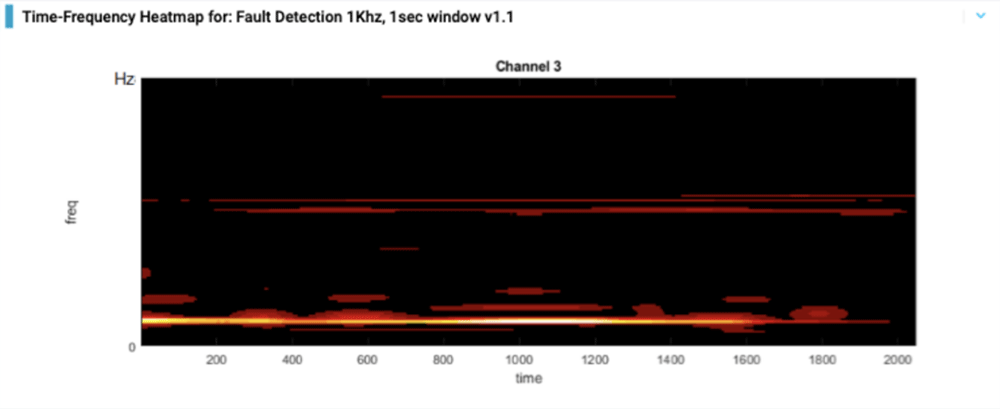
Take this example — also vibration data — comparing two classes in a rotating tire: properly inflated and under-inflated. In this case, the feature space selected by the algorithm was much more complicated, but because it was based on signal processing mathematics, the feature computations can still be projected into time and frequency.

In this plot, the vertical axis is frequency, the horizontal axis is time, brighter pixels indicate more important time-frequency points for making the distinction between our two classes. The horizontal streaks would still have been picked up by an FFT, but the time structure in the lower part of the spectrum — basically the "womp womp womp" pattern near the bottom — requires more complex mathematics, in Reality AI Tools automatically discovered using machine learning. An engineer that thinks in terms of time and frequency domains can immediately look at this and understand what is happening — without understanding the details of the feature space, and without knowing anything at all about machine learning.
The Best Way is the Simplest – "Inherent Explainability"
Certainly for the engineering applications — but I suspect for many others too — the best route to explainability is to start with the explanation. Build models based on features that those who need to receive explanations inherently understand, then maintain traceability of those features through the model so that results can be analyzed through the lens of those measures. It's worked for us.
